Make talent quality your leading analytic with skills-based hiring solution.
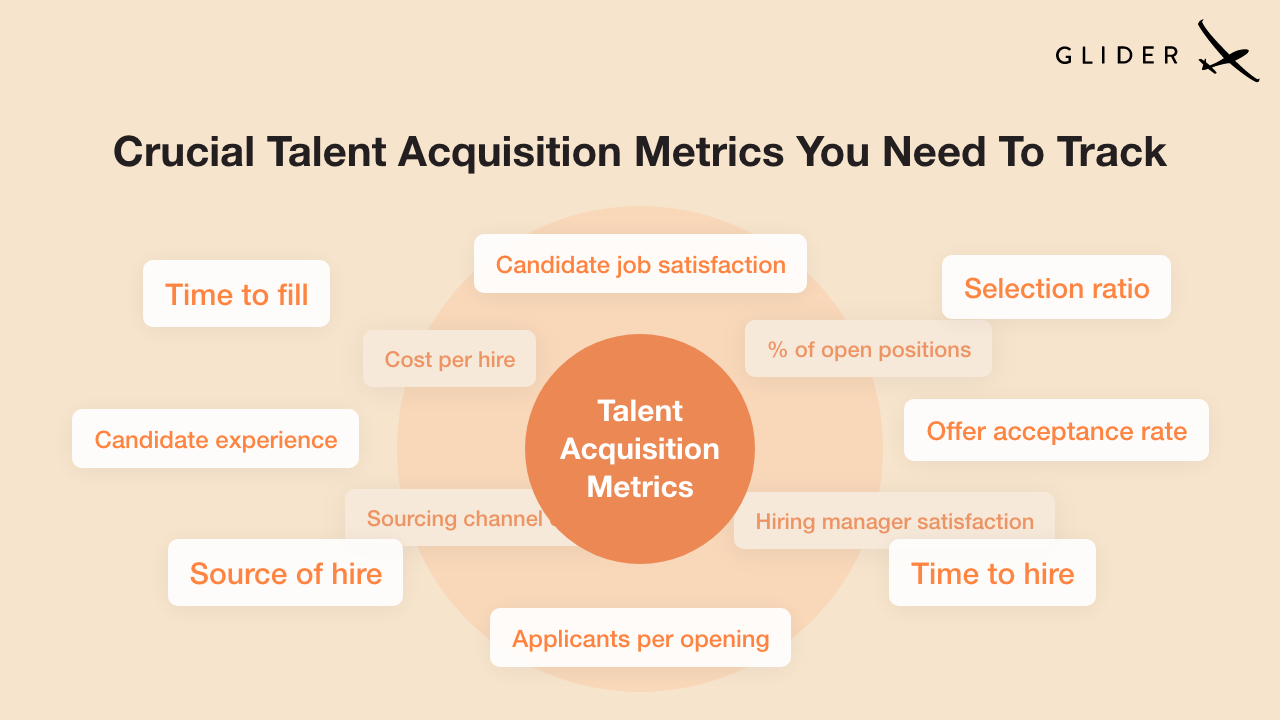
The talent acquisition metrics that matter most are time to fill, quality of hire, cost per hire, offer acceptance rate, pipeline conversion and first year attrition. Together they show whether your hiring process is fast, affordable and producing people who succeed. Track speed and cost, but judge the process on quality.
Most recruiting dashboards are heavy on activity: applications received, emails sent, interviews scheduled. Those numbers are easy to collect and easy to improve without hiring anyone better. The talent acquisition metrics below are the ones that tell a TA leader whether the team is making better hiring decisions, and the ones a hiring manager will actually care about.
A recruiting team without good metrics argues from anecdote. A hiring manager says the last three hires were weak, a recruiter says the requisition kept changing, and nobody can show what happened. Clear talent acquisition metrics give both sides the same facts. They also show where to invest: more sourcing, better screening, faster scheduling or stronger offers.
Time to fill is the number of days between opening a requisition and an accepted offer. It reflects the whole process, including approvals and hiring manager availability. Track it by role family, since a software engineer and a call center agent should not share one target.
Time to hire starts when a candidate enters your pipeline and ends when they accept. It isolates how fast your team moves a specific person through. Long gaps between stages usually point to scheduling and feedback delays.
Quality of hire measures how well new hires perform and stay. Common inputs are performance ratings at 6 and 12 months, hiring manager satisfaction and retention. It is the hardest metric to collect and the most important, because every other metric only matters if the people you hire succeed.
Cost per hire adds internal costs (recruiter time, tools) and external costs (job ads, agency fees, assessments) and divides by the number of hires. Watch it alongside quality. Cutting cost by skipping screening often shows up later as attrition.
Offer acceptance rate is accepted offers divided by offers made. A falling rate usually signals pay gaps, slow processes or a candidate experience problem somewhere earlier.
Conversion rate tracks the share of candidates who move from each stage to the next: application to screen, screen to interview, interview to offer. It shows exactly where qualified candidates drop out or where unqualified ones slip through.
Source of hire shows which channels produce people who get hired and stay. Pair it with quality of hire to stop paying for sources that bring volume but not fit.
First year attrition is the share of new hires who leave within 12 months. High early attrition often traces back to a mismatch between the role and the skills that were tested during hiring.
A short survey after each hire asks hiring managers how well the shortlist matched the role. It is a fast, early read on quality before performance data exists.
Candidate surveys and assessment completion rates show how applicants feel about your process. Strong candidates have options, and a clumsy process loses them.
| Metric | What it tells you | Review cadence | Main owner |
|---|---|---|---|
| Time to fill | Overall process speed | Weekly | Recruiting manager |
| Time to hire | Speed once a candidate is in the pipeline | Weekly | Recruiter |
| Pipeline conversion | Where candidates drop or slip through | Weekly | Recruiter |
| Offer acceptance rate | Offer and process competitiveness | Monthly | TA leader |
| Cost per hire | Efficiency of spend | Quarterly | TA leader |
| Source of hire | Which channels work | Quarterly | TA operations |
| Quality of hire | Whether hires succeed | Quarterly or twice yearly | TA leader and hiring managers |
| First year attrition | Fit between role and hire | Quarterly | HR and TA |
Speed and quality are often treated as a tradeoff. In practice, the biggest gains in both come from the same change: better evidence earlier in the process.
For a deeper look at automation, see our guide on what hiring automation is. If your process runs online, read how teams are tackling hiring challenges with online recruitment.
Glider AI, a Findem company, helps TA teams improve quality of hire and time to fill by putting skills evidence at the front of the funnel. Skill Assessment Software lets recruiters test candidates on real job tasks for technical and non technical roles, with proctoring and identity checks built in. Hiring managers receive a shortlist backed by scores and recordings, which means fewer interviews spent on candidates who were never a fit.
That change shows up across your talent acquisition metrics: pipeline conversion becomes cleaner, interview time drops, and quality of hire has a measurable starting point because every hire was assessed against the same standard.
Quality of hire, time to fill, cost per hire, offer acceptance rate and first year attrition are the core set. Quality of hire matters most because it shows whether the other metrics are producing people who succeed.
Combine performance ratings at 6 and 12 months, hiring manager satisfaction and retention into a simple score. Keep the formula consistent across roles so trends are comparable over time.
Start with time to fill and pipeline conversion, since they are easy to collect from your ATS. Add hiring manager satisfaction next as an early quality signal, then build toward full quality of hire.
Review speed and conversion metrics weekly, offer acceptance monthly, and cost, source and quality metrics quarterly. Quarterly reviews give enough hires to show real trends.
Fast hiring without good screening moves weak matches through quickly. The cost shows up later as poor performance and early attrition, which wipe out any savings from a shorter time to fill.
Time to fill runs from when the requisition opens to an accepted offer. Time to hire runs from when a specific candidate enters the pipeline to their acceptance. The first measures the whole process; the second measures how fast your team moves a candidate.
Track speed and cost, but let quality of hire decide whether your process is working. If you want a reliable way to improve it, explore Glider AI Skill Assessment Software and start measuring every candidate against the same skills standard.

Global hiring fraud hotspots are the countries and regions where documented candidate fraud and identity verification risk run highest, based on named industry indices rather than assumption. In 2026, that data points consistently in one direction: fraud vulnerability is concentrated in markets with weaker centralized identity infrastructure and fast growing digital hiring volume, led by […]

A synthetic candidate is a job applicant who does not exist as a single real person at all. The persona is assembled, usually by combining stolen or purchased personally identifiable information (PII) with an AI generated resume, an AI generated or composite photo, and an invented work history, into a package that looks, on paper […]

Hiring overqualified candidates is not automatically a mistake, but it is a decision that carries real, well documented risk if the role and the offer are not restructured around it. Recent survey data shows most employers already do this regularly: 70 percent of hiring managers say they typically consider candidates who are overqualified for the […]